
In the previous post we looked on how to configure Azure Monitor Alerts for Critical events that occurs on Microsoft Windows Devices which can be used for monitoring the Teams Room Systems. With Azure Log Analytics we could leverage few more components that will help us to visualize the status of the systems which are monitored through selected event logs and the performance counters.
Creating the Workbooks and making them visualize purely depends on the data that is been ingested on the corresponding log analytics workspace. So at the first stage its very important that we are sending all the required logs and counters which is mandatory for visualizing the metrics.
Firstly before creating the workbooks we need to devise a strategy on how to build a skeleton for the dashboard. This is very important since there are multiple options available and need to understand what important data that needs to be projected on the dashboard.
We will go through few examples of how to get started with creating the workbooks and visualizing the data.
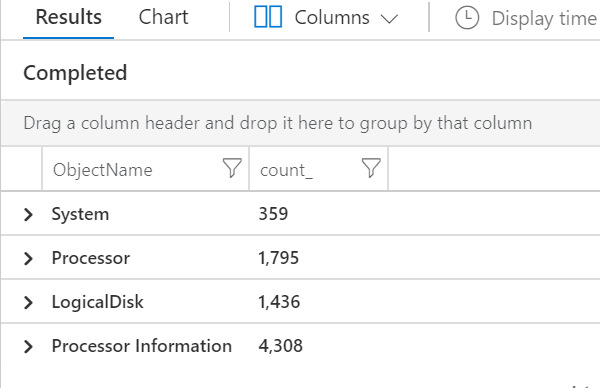
We need to prepare the required Kusto Query Language which is required for visualizing the data. Below is a small example of one which will visualize the count of the perf counters by object name
Perf
| where TimeGenerated > ago(1h)
| summarize count() by ObjectName
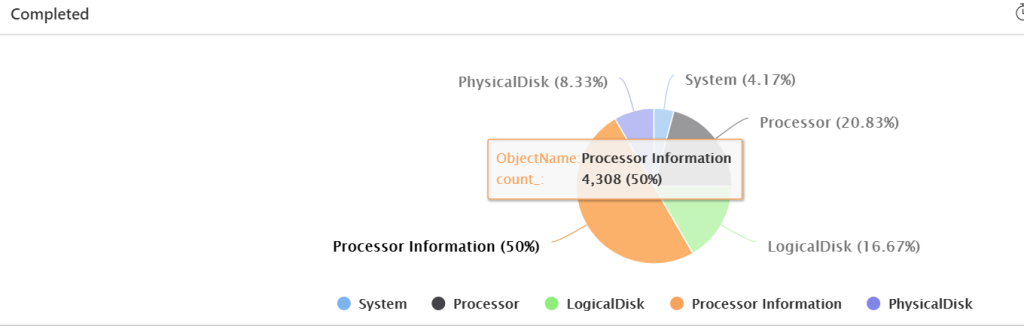
To Render them as a pie chart we can use the below information
Perf
| where TimeGenerated > ago(1h)
| summarize count() by ObjectName
| render piechart
Example below will project only the affected systems which has failed windows updates, driver updates or any devices connected with room systems which are in a failed state.
search *
| where Type == "Event"
| where EventLog == "System"
| where EventLevelName == "Error"
| extend Status = parse_json(RenderedDescription).Description
| where RenderedDescription has "failed"
| project TimeGenerated, Computer , RenderedDescription
If we need to visualize them on a graphical pie chart we could do that as well by summarizing them to a string value which is available from the parsed json file. Example it can be computer, Ip address , Device name or any data which is present on the raw event data.
search *
| where Type == "Event"
| where EventLevelName == "Error"
| extend Status = parse_json(RenderedDescription).Description
| project TimeGenerated, Computer,RenderedDescription
| where RenderedDescription has "failed"
| summarize Count=count() by tostring(Computer)
| render piechart
Above are just very few examples of rendering the data and making them visualize through kusto query language. There is a lot to explore and can project more data based on the logs that we are adding on the azure log analytics.
Now we have got some idea of how to create the visualization through the kusto query language there is an option to combine multiple queries and display them as a dashboard through Azure Workbooks. Earlier this option was enabled by view designer which is now replaced by enhanced version called Azure Workbooks.
There are multiple options which can be utilized and created dashboards with Azure Workbooks and below we will go through few of the options which will help us in creating our customized workbooks.
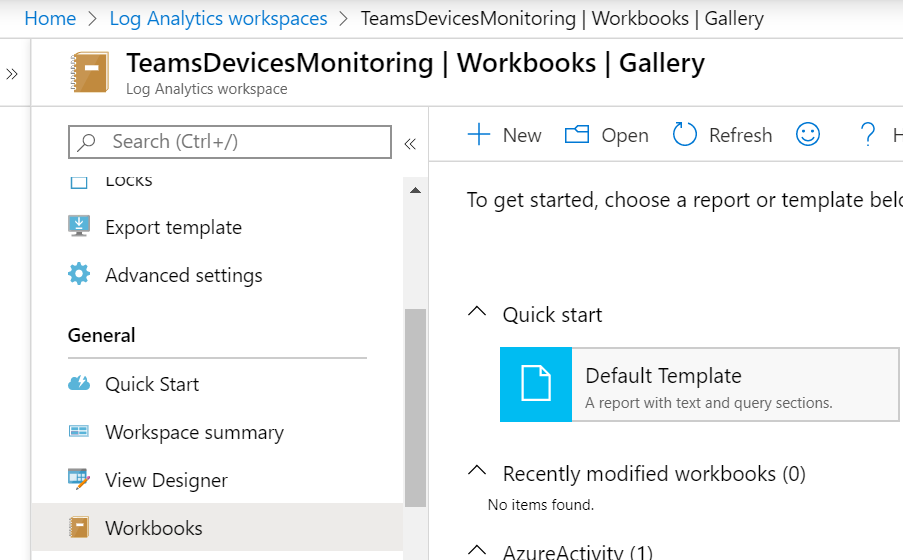
In order to get started with Workbook – Navigate to the log analytics workspace – Choose Workbooks
Click on New
We get the default summary of our query from our workspace with the below piechart view.

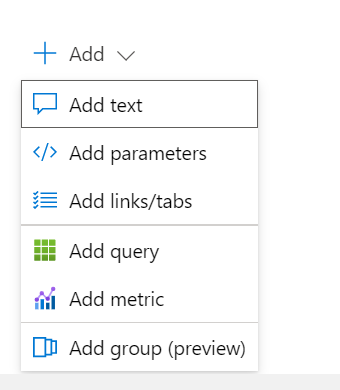
If we want to go with our own query we can remove the default query and select Add. Here in Add we have multiple options like below out of which Add Group seems to be very much interesting. With Add group we have the ability to add multiple queries and group them in a single workbook.
At the top of this group we have an option to add text which visualizes the workbook name and the details.

After selecting the group , now we have option to add query into the group.

When going into the advanced settings we have these options now to display the chart titles specific for this query.
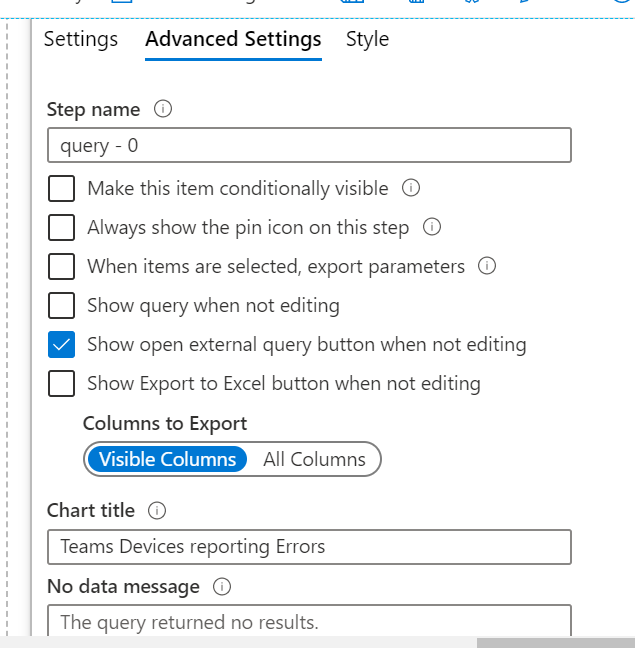
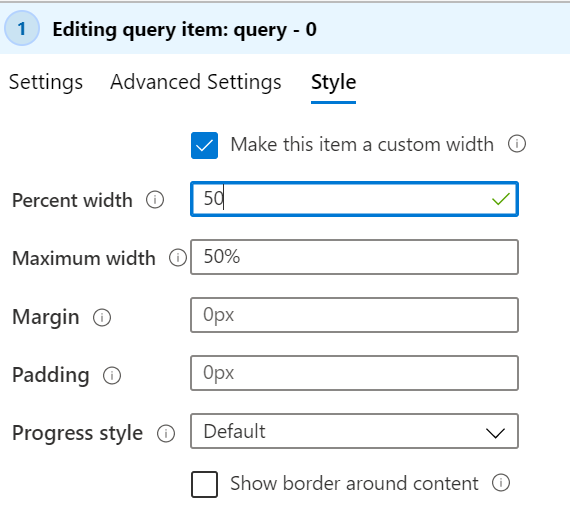
In the style tab we do have some options to modify the HTML settings. By default this will fit in to one query per row and if we need to add three queries we need to adjust the width settings.
In below case I have added the width to 50 since trying to add 2 queries in a row. But its very important to note here that adding 3 columns and making them visible as a dashboard is fine only in Azure Dashboards. If we try to view them from Azure Workbooks 3 queries in a row is not sufficient to accommodate and we do not have option to modify the HTML editor at this moment.
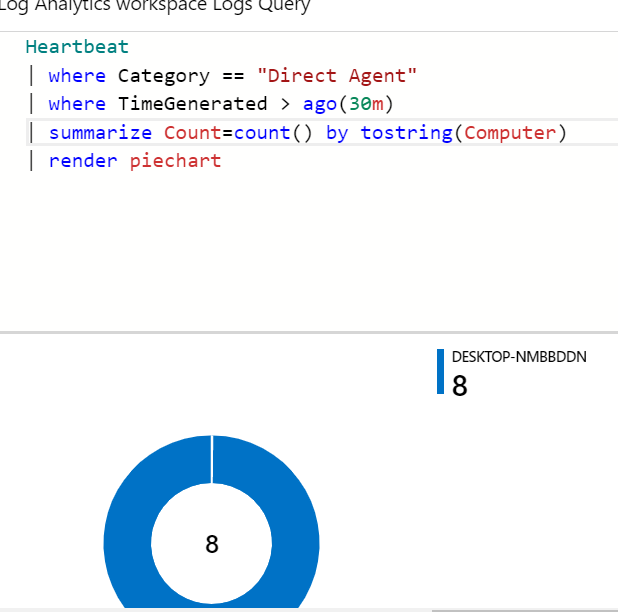
Have added another query which will let us know the status of the systems which have reported the heartbeat in last 30 minutes through the perfom counters. In below case since I have only one system for demo it shows only 1 system.
The moment when we group them and display it shows the view as below. By adding multiple queries based on our requirement it makes us easier to create the dashboards.

Further to this we have a lot of options in the visualization of the display based on the metric units. We can go through few of them.
For instance there are below options available to set visualization.
We can reduce the size of the visualization and we have 5 options.

Further in the chart settings we have option to define the column and the units.
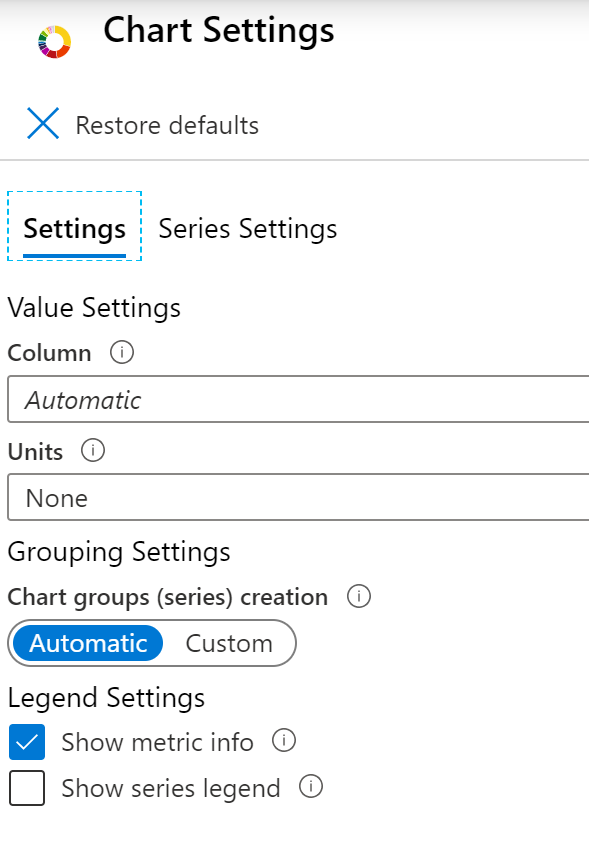
In the series we have option to change the colour and add a custom display label.


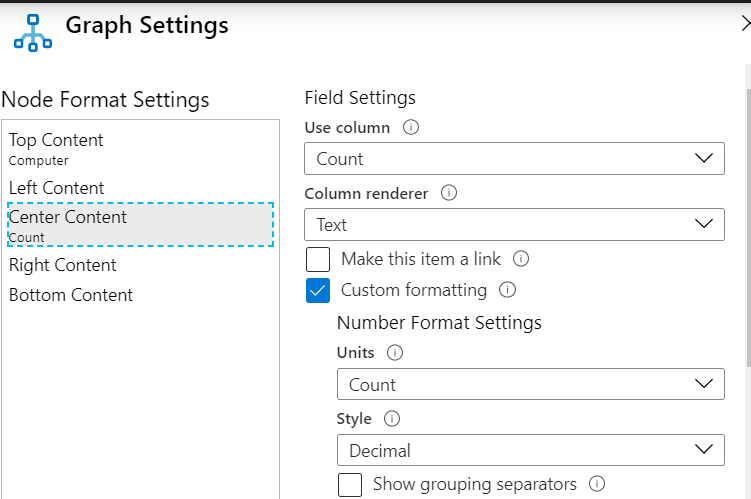
To interpret further have chosen Graph which is very interesting.When entering into the graph settings we have the below options in the node format settings. This helps us to choose what fields that we can display on the view of these images in the dashboard.
We have furthermore tweaking information on the layout settings. The hive clusters are looking really nice like honeycomb in the visualization. And there is a category to group by field to select based on the available fields.

Now we have the category to choose based on the coloring type. Ideally this is very good to categorize based on healthy and unhealthy systems. This will group the healthy and unhealthy systems separately and finally display them as dashboards.

This blog gives an overview of how to visualize , group and create Azure Workbooks from Log Analytics WorkSpace. With Azure log analytics and Azure Workbooks it makes very much easier to monitor the modern Windows 10 & Linux devices. This facility can be very much leveraged easily in a direct cloud deployment model without the need of installing, configuring and maintaining a local monitoring solution.
Thanks & Regards
Sathish Veerapandian


[…] the previous post we had a look at how to group multiple azure log analytics queries ,group them and display them in […]
LikeLike
[…] and pin them as a separate dashboards for Microsoft Teams related activities. I have also written post on creating Azure Monitoring Workbooks which can be referred for creating dashboards for Teams […]
LikeLike