
In the previous post we had a look at how to group multiple azure log analytics queries ,group them and display them in one screen. There are few real challenges in displaying the queries directly from the workbook. Firstly they are not having the capability to auto refresh the live data until we reload the workbook. There is no option to fit the dashboard and customize them as per our requirement. Finally there is no option to set the refresh rate, setting up the local time zone and sharing them to the required persons to view them with read access.
Creating the dashboards is much easier and there are multiple ways to do them. In this post we will have a look at creating one from the workbook.
Inorder to create a workbook navigate to Azure Log Analytics Workspace – Click on WorkBooks – Select the workbook that needs to be created in dashboard.

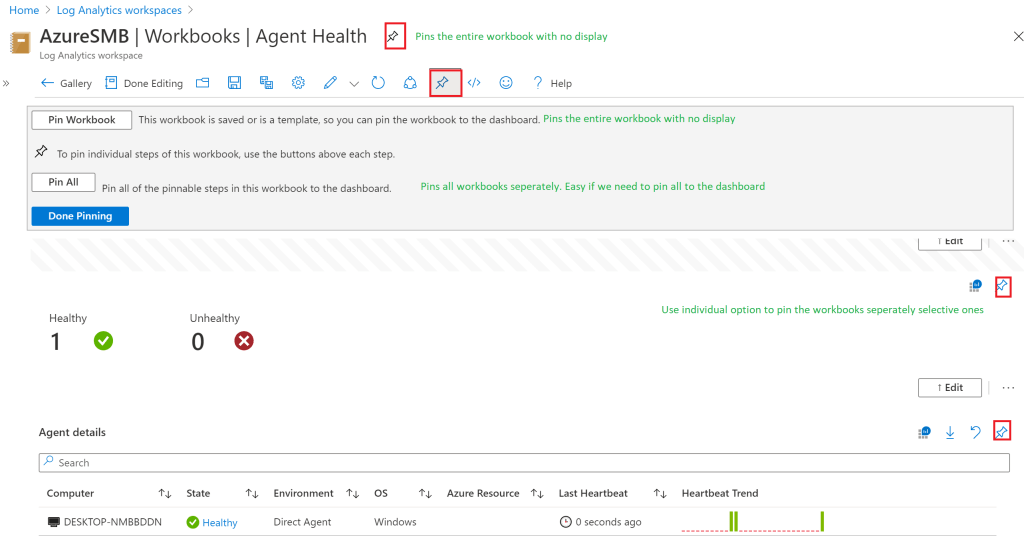
In below example just for demonstration the default health agent work book is selected. Once selected choose edit and go to pin options
We have the below pinning options
Pin Blade to Dashboard – Pins the entire workbook.
Show pin options has below ranges to choose
Pin Workbook – It again pins the entire workbook as a workbook template
Pin All – Pins all the created queries as dashboard. This is best recommended option
Individual Pin – Individual pin option can be used to choose only selected queries and pin them on the dashboard.
Once its pinned – We can navigate to Azure Dashboards – Navigate to azure portal – Click on Azure Dashboard we can see all the selected queries.
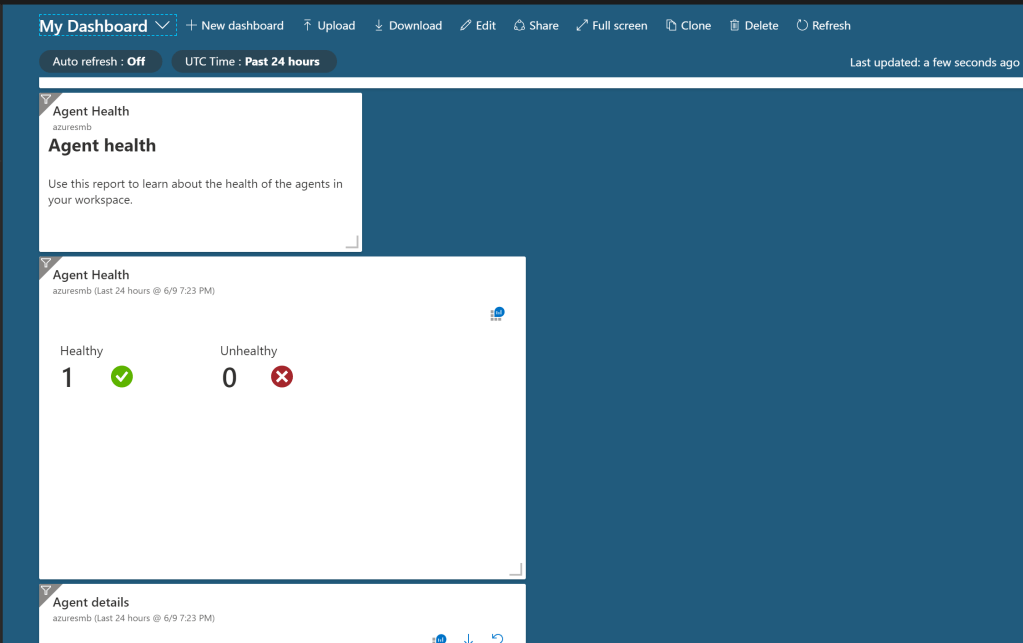
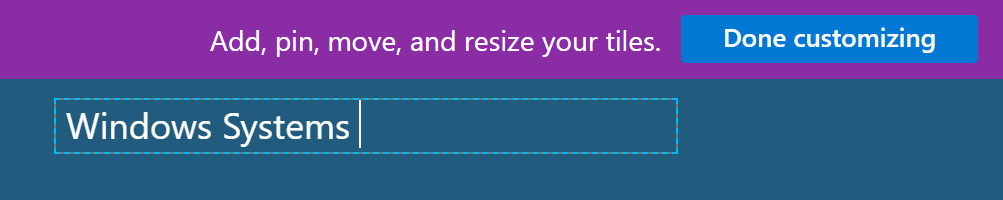
Now we need to align them by just clicking on edit on the dashboard. Here we get lot of options like add, pin , move and resizing the tiles. We have few metrics in the tiles gallery which can be added.

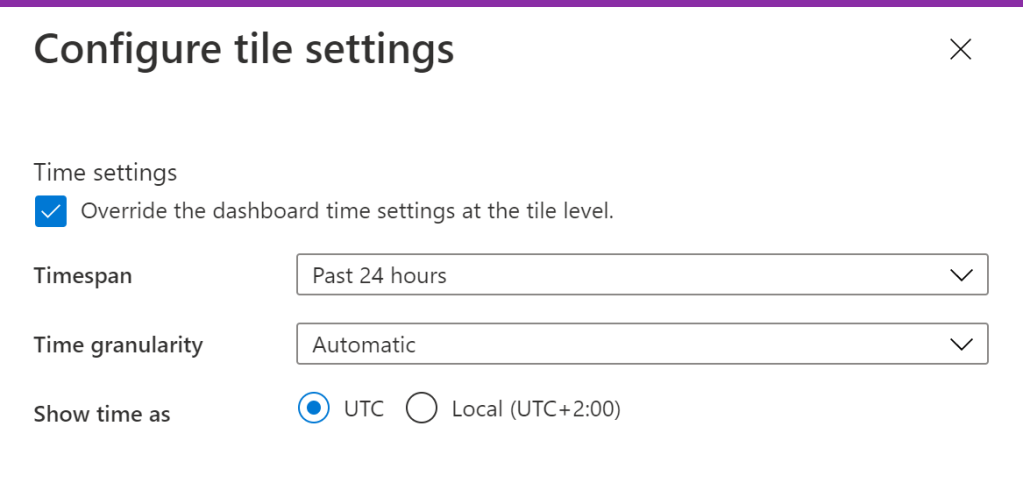
We have options in tile settings.There is option to configure the timespan and choose the time granularity as per our requirement.
Even we have an option to choose the time as per our requirement.
There option to name the dashboard as requested.
Once customized when navigated to full screen it shows the below option in the dashboard. Below is just a sample of dashboard created from the log analytics workspace.

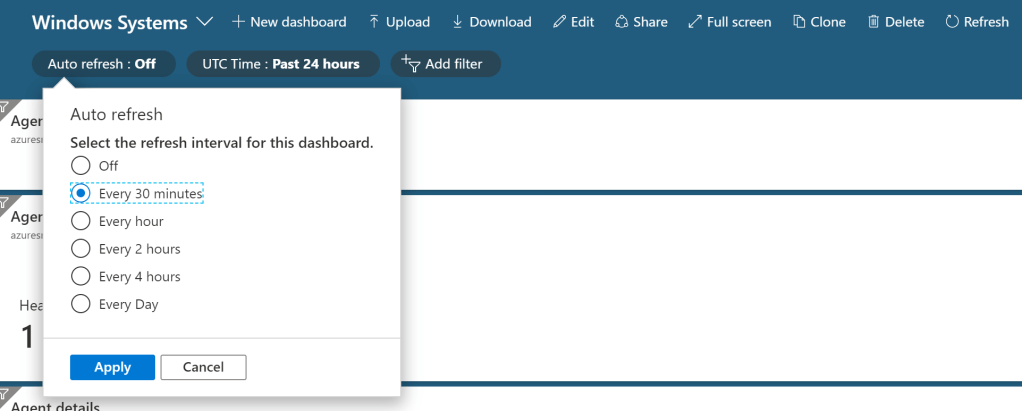
Furthermore we have options to choose the refresh interval rate which refreshes the data from the logs present in the log analytics which is inturn collected from the agents installed in the active systems.
There are also other options like to download the created dashboard in json format. Even upload option is present which accepts json format file.
Sharing option is present where we can share this dashboard to a group of people by targeting them to a read only group. When clicked on share it is private.

After it has been shared we will get the access control options.

Once clicked on managed access we have option to add users in role assignments. There is an option to unpublish the dashboard as well and when done it is made again as private dashboard.

Clone option is also present where we can just clone one existing dashboard and modify the queries on the background.
Creating azure dashboards made admins life simpler in lot many ways in deployment of monitoring solutions for newly installed windows , linux , network devices and even databased through azure log analytics.
Regards
Sathish Veerapandian


Leave a comment