
With Microsoft PowerBI we can gather more details from the call quality dashboards. As of now Microsoft have released 7 power BI desktop templates to accumulate more details on the Microsoft teams call quality dashboard.
PowerBI being a very potential platform for data gathering and analysis these new templates for Microsoft Teams have been more outstanding in terms of analyzing the Microsoft Teams data.
We will go through the overview of the reports and the configuration on this post.
Firstly the PowerBI Query Templates for Microsoft Teams needs to be downloaded.
We have below 7 templates report:
- CQD Helpdesk Report.pbit
- CQD Location Enhanced Report.pbit
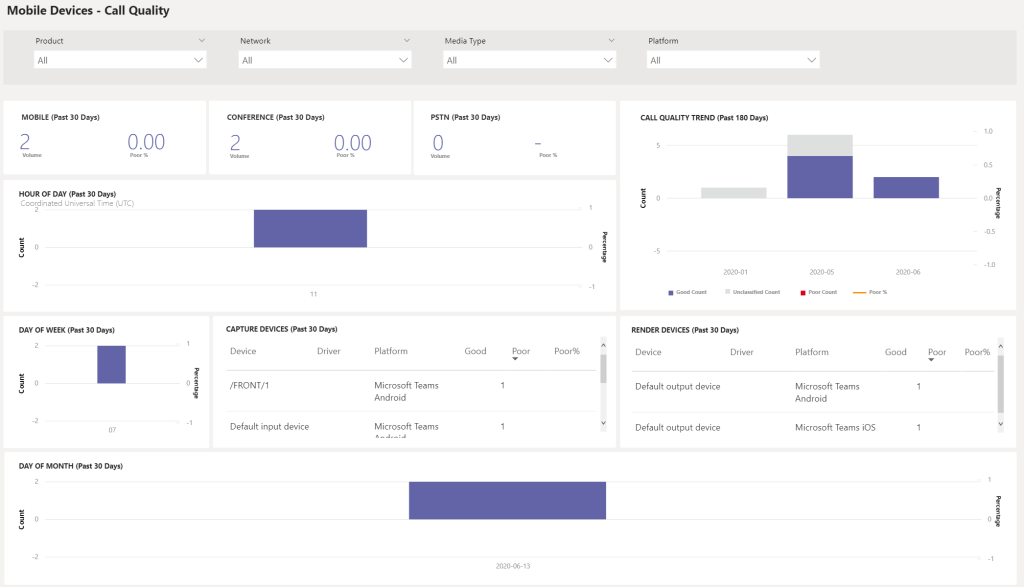
- CQD Mobile Device Report.pbit
- CQD PSTN Direct Routing Report.pbit
- CQD Summary Report.pbit
- CQD Teams Utilization Report.pbit
- CQD User Feedback (Rate My Call) Report.pbit
These are customizable templates which can be used to analyze data. These above are PBIT file formats which can be used from PowerBI desktop which has the data source configured. If we need to open them directly from the powerbi portal they need to be renamed as pbix. If we are importing them from the powerbi desktop the following file MicrosoftCallQuality.pqx needs to be imported to the location [Documents]\Power BI Desktop\Custom Connectors folder.
From Desktop:
The initial requirement is that the PowerBI Desktop version must be installed and the data gateway already configured. The steps from Microsoft can be followed from here
Place the pqx file in below location. The below location will be automatically created once the desktop version is installed.
Set the data source:
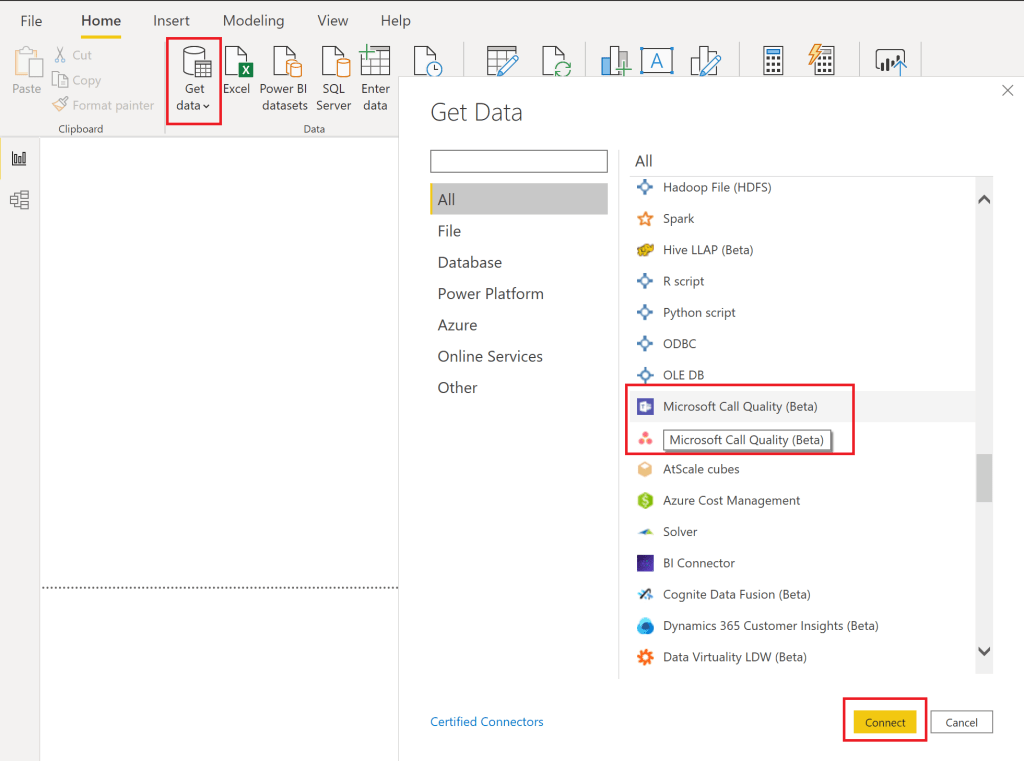
Option 1: Use the Microsoft Call Quality (Beta)
In-order to set the data source open Power Bi desktop – Select get data – choose Microsoft Call Quality (Beta)
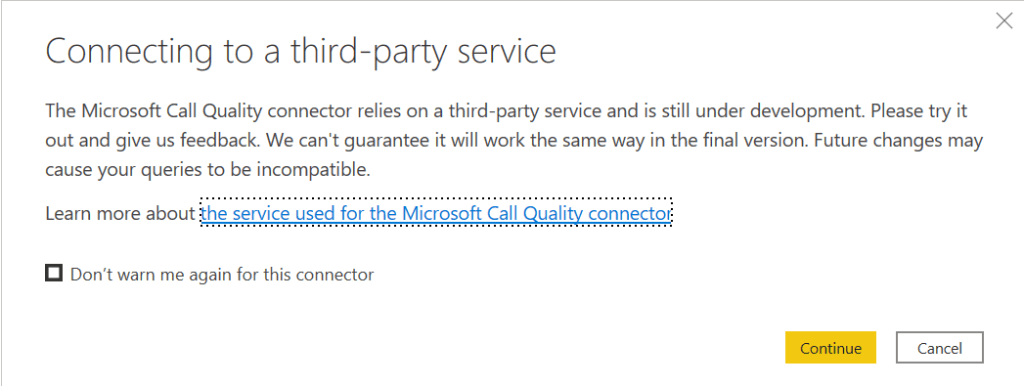
Once it has been connected we could see the below message as disclaimer since it is on beta roll-out at the time of writing this blog.
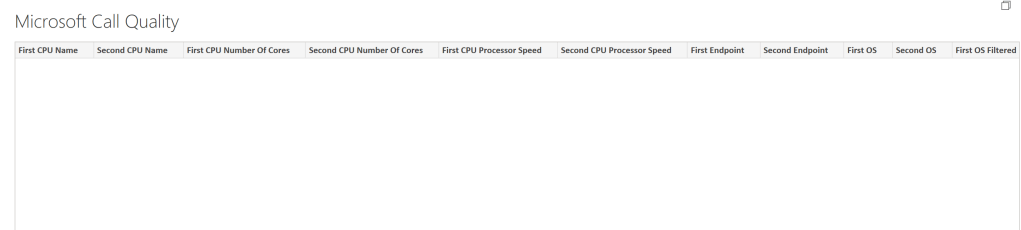
Next we will be having the below option which has all the details to build the query.
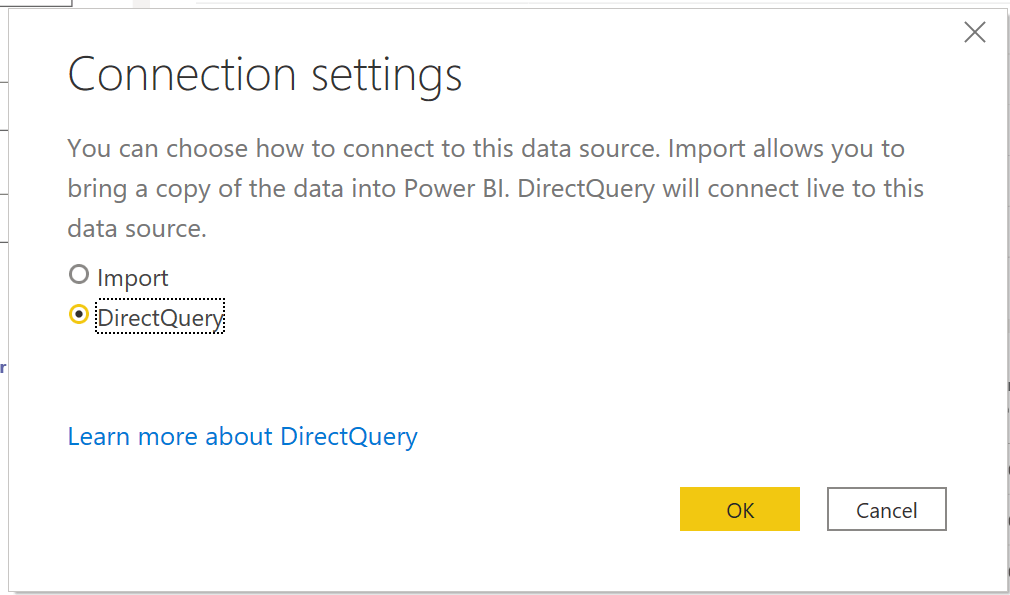
The moment when we click on load we will be presented with the below screen. Here we need to select the option direct query since we are getting the data directly from the Microsoft call quality dashboards.
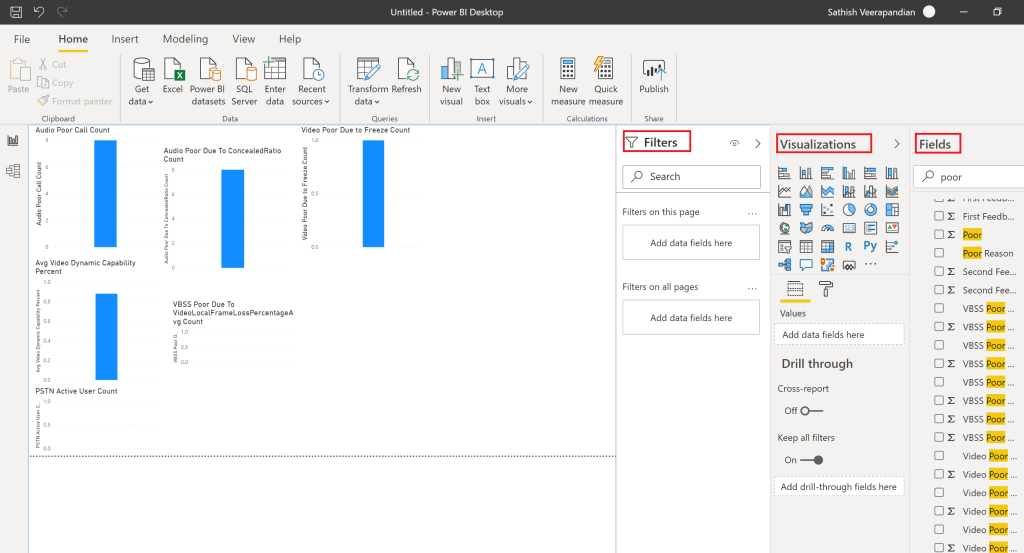
Once connected we will have all the options to build our own custom reports by selecting all the required fields from the right , visualizations and filter. This option is very beneficial where we have our office network details uploaded on the call quality dashboard for detailed analysis and building our own custom dashboards. Here we have selected few fields for example and could see they are populated on the dashboard.
Option 2: Import the Teams PowerBI Templates report and publish them from the desktop.
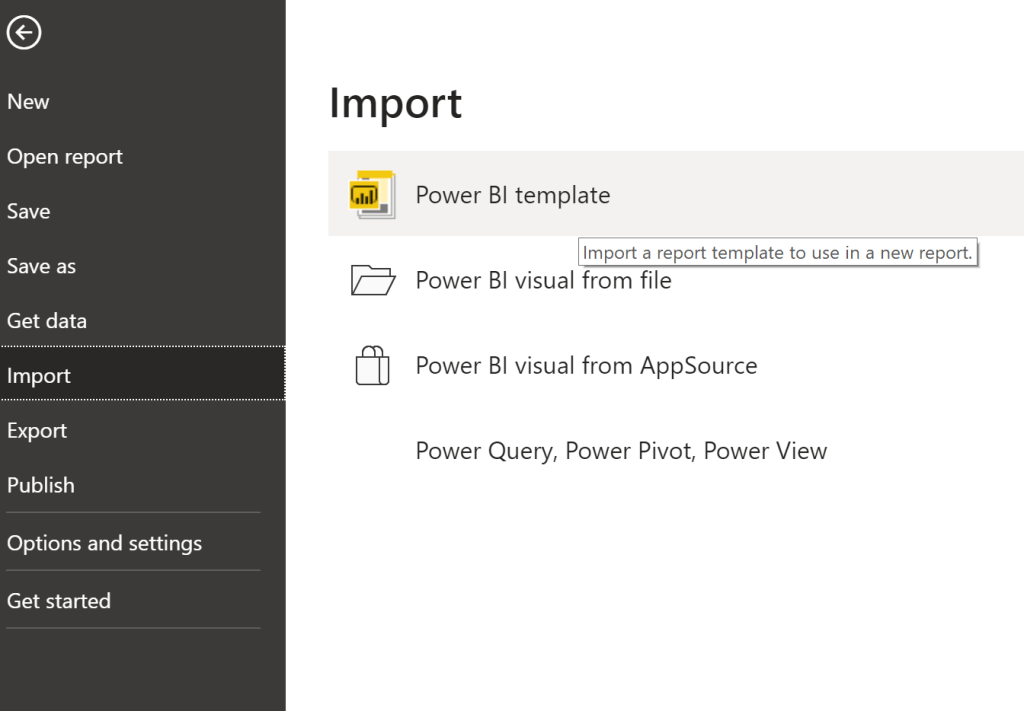
The second option is to import the PowerBI Templates and publish them on the desktop. Inorder to import them navigate to file- import – select power bi template and import all the pbit format files. These templates have to be imported one by one.
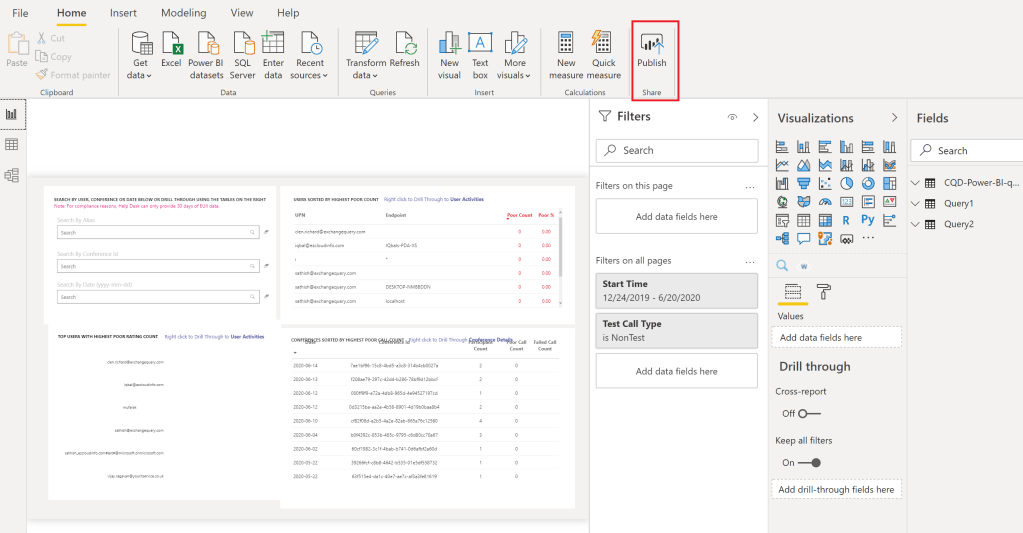
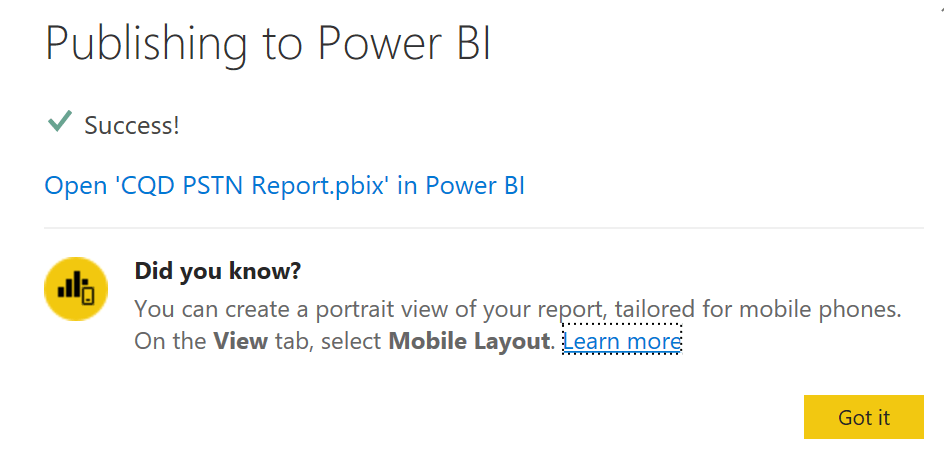
Once imported we get all the details as per the template imported. We do further have an option to customize the reports. Click on publish to publish the reports directly to the workspace.
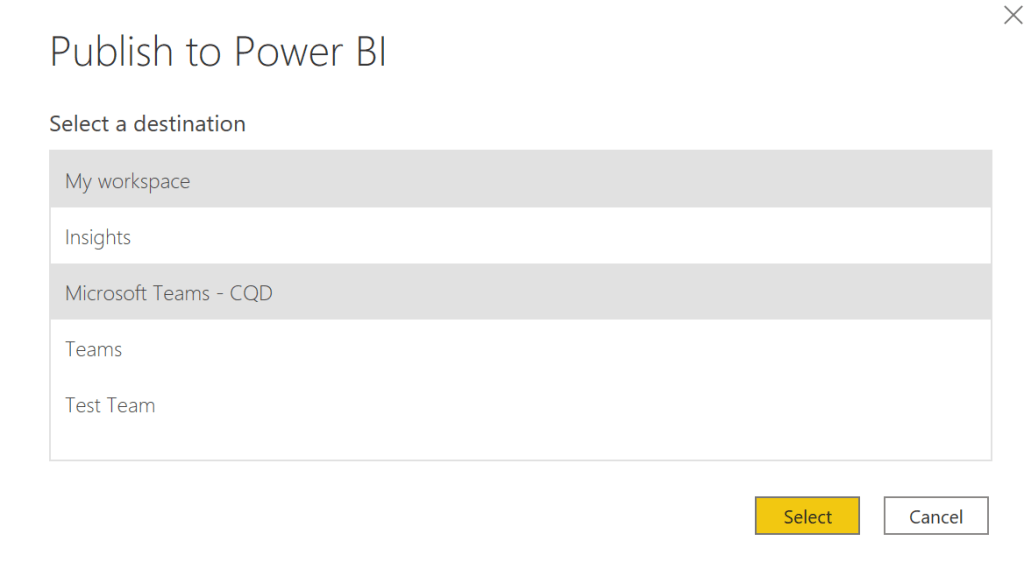
Choose destination the workspace to be published. In our case we have selected Microsoft Teams – CQD and thats the workspace created in PowerBI for Teams CQD.
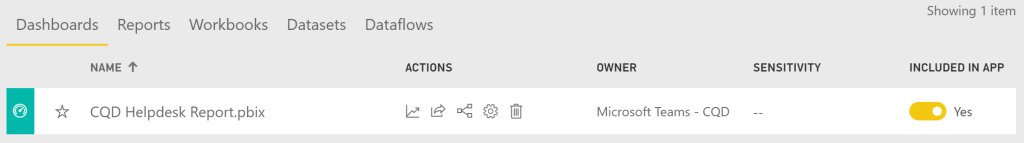
Once its published we have the dashboards published in the workspace and ready to share.
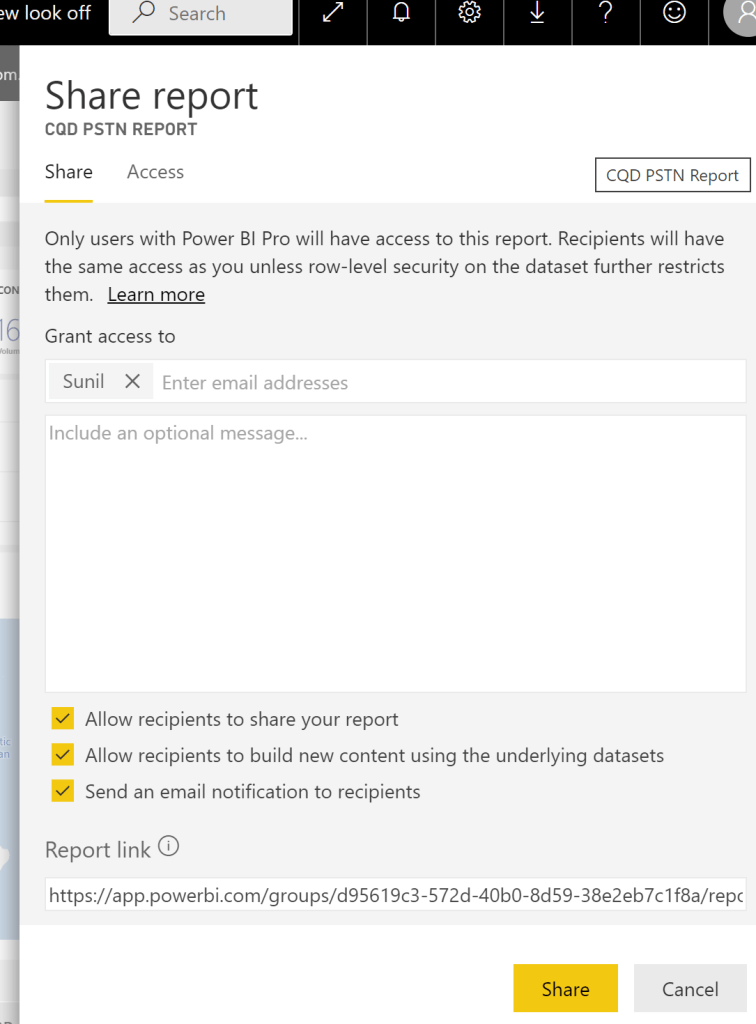
When clicked on share we have the below options while sharing the report. Users will need powerbi pro license and CQD access role to access this report.
Importing from the PowerBI Web Portal:
Importing them from the web portal is very much easier. We need to click on the datasets – files and select get option since we need to import the downloaded files here to create the new content.
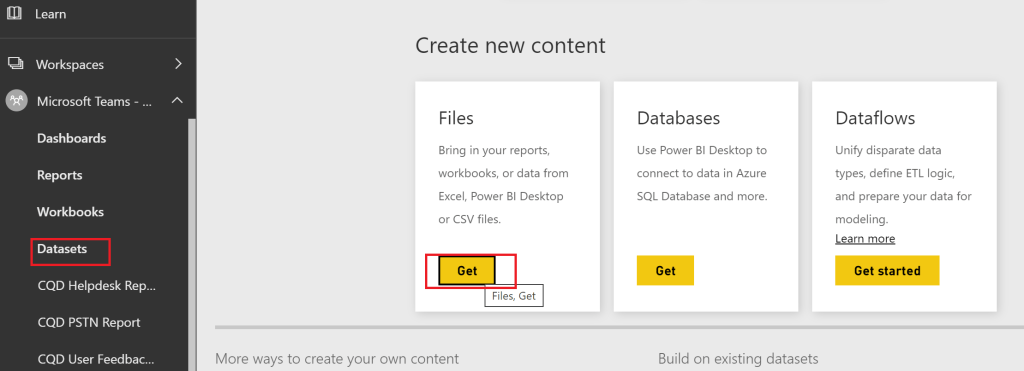
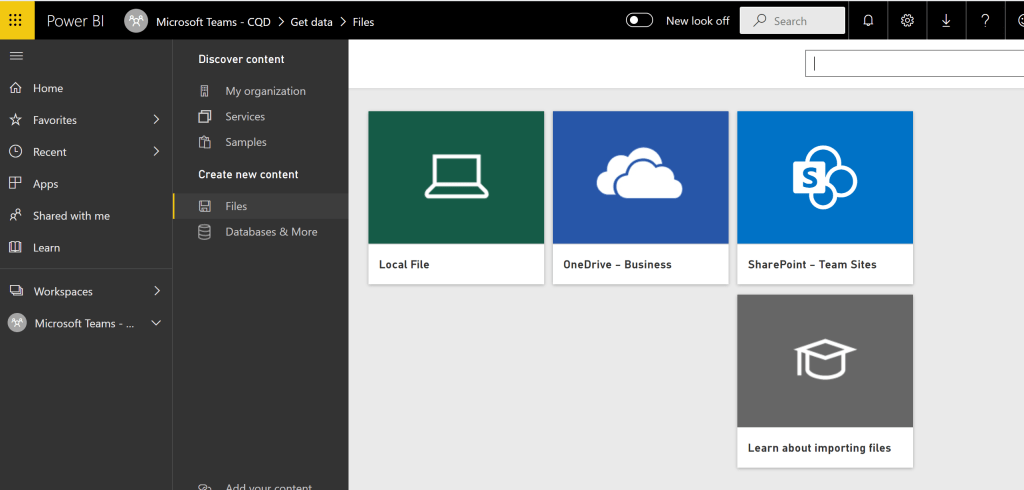
Select files and click on local file and choose the powerbi templates. Here we need to rename all the file formats to pbix since the portal will not recognize the pbit format version.
Once uploaded we can see the dashboards. The template dashboards have lot of information especially with user details breakdown which is very nice. The below example is from CQD Helpdesk Report. Here we have an option to search by users, conference or by date which is very convinient.
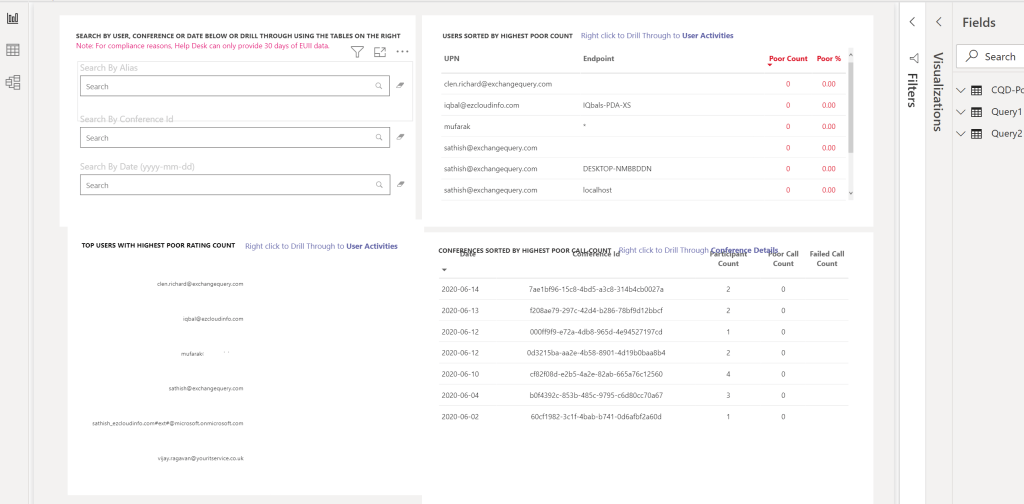
Further from the user activities tab it gives us more report as example below. The good thing is that we could see the device information on the end point.
Below example comes from CQD Teams Utilization Report. This gives more info on how the Teams is utilized by users in our organization.Few samples from the templates. The call count summary gives all the information in one view.
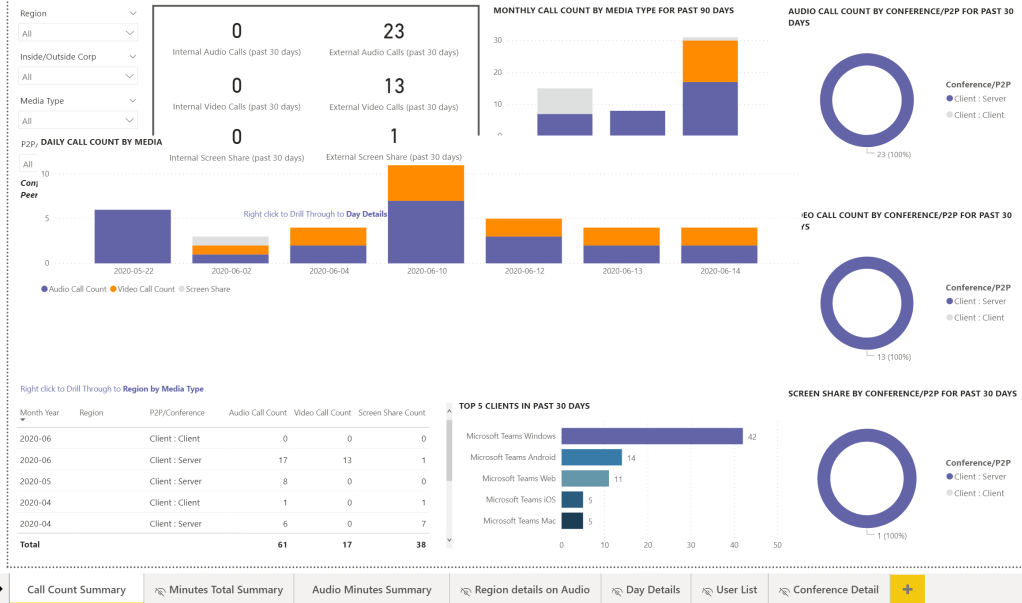
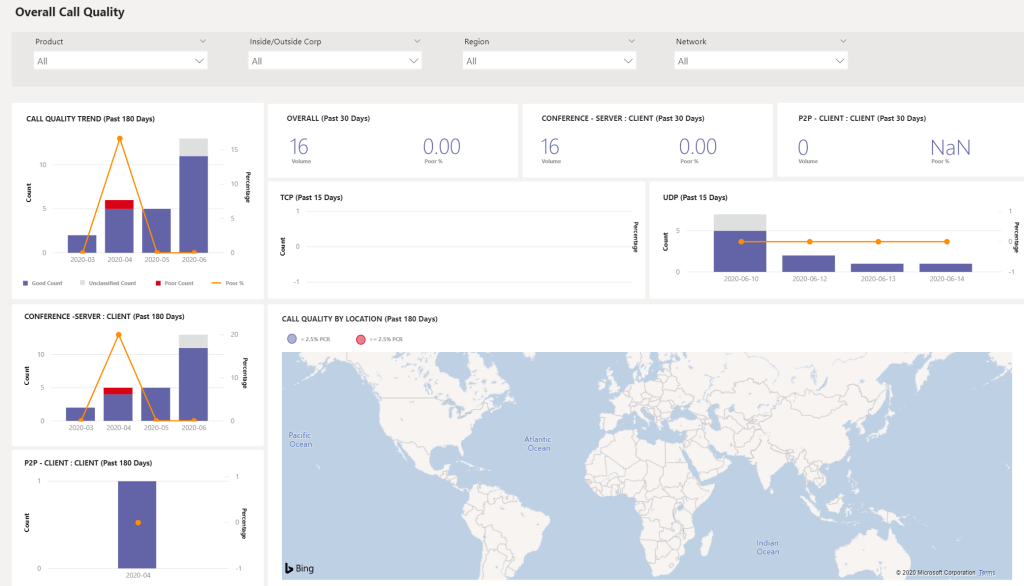
We get the location details as well in the over all call quality and gives the data for past 180 days.
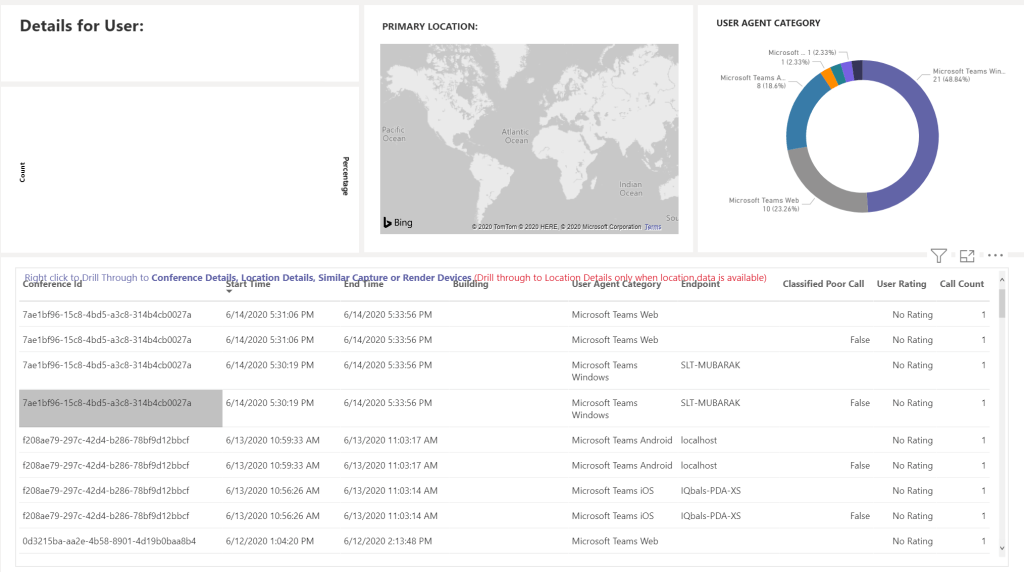
User details are very impressive where we can see the app version, drivers and further we have filters on the right to customize the view.
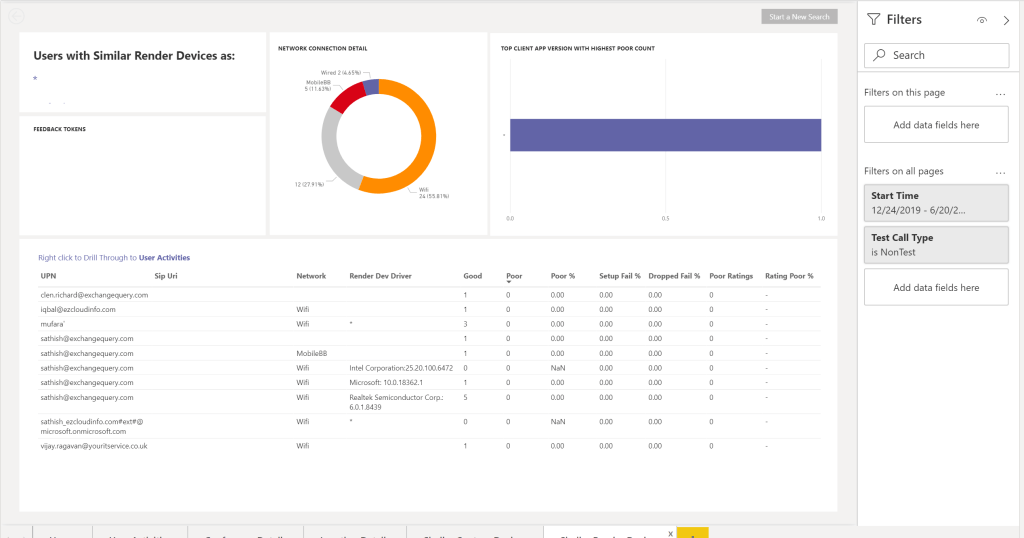
Below example shows day details breakdown with further customization filters and fields to get data based on our requirement. The default report itself has lots of required data which is very great.

The mobile devices all quality also have lot of useful information with overall summary.
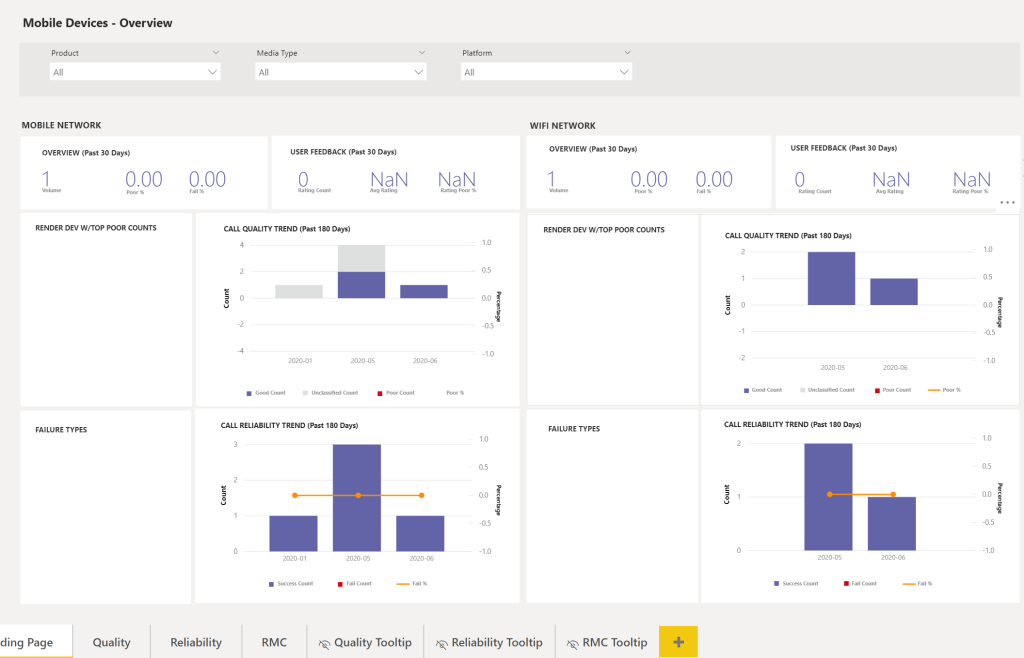
We get the mobile devices call quality with rendered devices, call quality trend and number of conference attended from the mobile.
The desktop version is very much convenient to create customization dashboards.Well there are more reports which are handy and available from these default templates which will be definitely useful and in the above examples we have gone through few of them. These reports can be customized easily and shared with less efforts and it gives a very good view with rich data experience.
Thanks & Regards
Sathish Veerapandian


Leave a comment