
In this blog we will look on ways to monitor the exchange 2016 services.
Configure health probes on Load Balancers:
Till Exchange 2010 the monitoring exchange we were dependent on SCOM . The SCOM management pack contained SCOM’s health manifests and correlation engines which used to collect analyze and report through SCOM.
The Exchange CAS servers were load balanced on a VIP and the LB’s used to check the CAS nodes just by pinging or telneting them frequently on port 443 , 80 to check the availability.
Behind the scene there can be the application services which might not be available like Exchange services not running but still the LB’s can ping them on required port.
In this case still the connections will be going to the CAS server on which the exchange services are stopped and unavailable .This does not give a 100 percent high availability and monitoring.
To address this From Exchange 2013 Microsoft has released a new component called Managed Availability.This is a self healing internal component that runs on every exchange server to monitor and fix any issues with the services on their own.It polls and analyzes hundreds of health metrics every second.
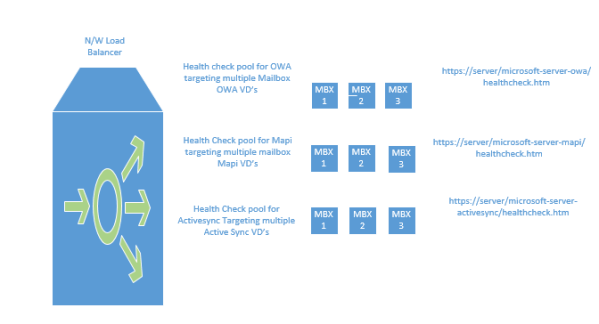
So there is a component called health probes which should be configured to monitor the Exchange services on the load balancers where the exchange services are published.
So we need to monitor the below probes from the loadbalancer:
https://server/microsoft-server-activesync/healthcheck.htm
https://server/microsoft-server-mapi/healthcheck.htm
https://server/microsoft-server-owa/healthcheck.htm
https://server/ecp/healthcheck.htm;
https://server/autodiscover/healthcheck.htm
https://server/ews/healthcheck.htm
https://server/oab/healthcheck.htm
So basically servers are monitored from the load balancers on each protocol level.
Meaning as per below example if the MBX1 has issues with OWA service and managed availability marks this service down the load balancer with the above configuration will be able to identify that MBX1 has only issues with OWA through offline responder and will take only the owa service out and keep the remaining service available and functional which is very good.
We can run the below command to check the component state
Get-ServerComponentState -Identity servername
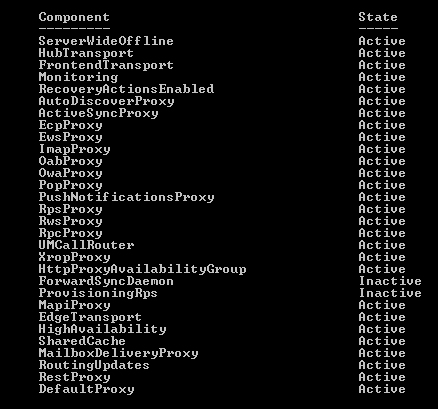
We can take the required components inactive during our maintenance interval as well.
We will speak only little bit about the components that are involved in managed availability since there are very good blogs about managed availablity written by other experts and MVP’s and do not want to explain them again here.
Managed Availability has two groups:
Health Sets – This is an internal view managed by managed availability using probes, monitors, and responders.It has the inbuilt capability to recover the services on its own if any issue occurs.
Below are the main components involved in Managed Availability
Probe – Check the services and its status very frequently.
Monitor – Monitors the probe result
Responder- Component responsible to take necessary action.
Responder has again below components :
Restart Responder – Terminates and restarts a service
Reset AppPool Responder – Stops and restarts an application pool in Internet Information Services (IIS)
Failover Responder – Initiates a database or server failover
Bugcheck Responder – Initiates a bugcheck of the server, thereby causing a server reboot
Offline Responder – Takes a protocol on a server out of service (rejects client requests)
Online Responder – Places a protocol on a server back into production (accepts client requests)
Escalate Responder – Escalates the issue to an administrator via event logging.
So the above tasks for health sets is an automated action and we do not need to perform any steps from our side.
Health Groups – Health groups are exposed to System Center Operations Manager 2007 R2 and System Center Operations Manager 2012 and reported via dashboard.This health group is required for the SCOM to give a detailed dashboard report of the exchange status.
Any issues that can’t be recovered automatically are escalated to the Exchange 2016 Management Pack as an alert
Responder that’s relevant for the Exchange 2016 Management Pack is the Escalate Responder.
When the Escalate Responder is triggered, it generates an event that the Exchange 2016 Management Pack recognizes and feeds the appropriate information into that alert that provides administrators with the information necessary to address the problem.
Below are the new additional health indicators added in the Exchange 2013 management pack
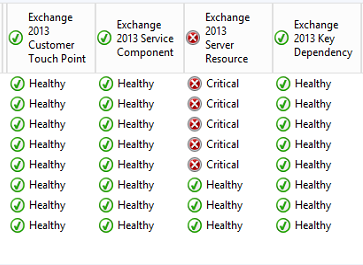
Customer Touch Points: This shows the end user experiencing status. If this indicator is healthy, it means that the end users do not have any issues with connecting to exchange and using its components.
Service Components: This shows the state of the particular service associated with the component.
For example, when navigated to the service component indicator for mapi this will indicate whether the overall mapi service is healthy.
Server Resources: This shows the state of physical resources that impact the functionality of a server.
Key Dependencies: This shows the state of the external resources that exchange requires to function. Examples like network connectivity, DNS ,Active Directory, storage.
Very IMP Note: There is not separate management pack available for Exchange 2016. Exchange 2013 & 2016 uses the same management pack as of now and Microsoft recommends to use only Exchange 2013 management pack for exchange 2016.
How to respond when Managed Availability cannot resolve a problem on its own:
Exchange team has centralized Exchanged monitoring inside of Exchange.
We can no longer configure monitoring thresholds in SCOM (other than turning on or off the SCOM monitor)
So how we admins can troubleshoot when the issue occurs :
Example if the owa says its unhealthy it is reported on the SCOM via an event logged on mailbox server
Check owa component state by running the below command on the affected mailbox server
Get-ServerHealth Server1.contoso.com | ?{$_.HealthSetName -eq “OWA.Proxy”}
Also check the owa healthcheck htm availability and see if you are getting 200 ok response by accessing the below url
https://server/microsoft-server-owa/healthcheck.htm
Then we can start troubleshooting on the affected component and try to bring them up.
Also noticed one thing that the managed availability will generate some logs on the below location.
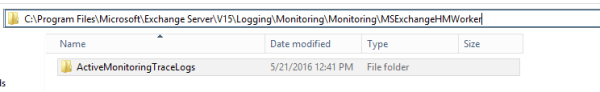
We can disable this and its not required and perform the below steps
Goto your exchange servers
Open <ExchangeInstallPath>:\bin\MSExchangeHMWorker.exe.config in a administrative notepad
Find the Line <add key=”IsTraceLoggingEnabled” value=”true” /> and change to false and save. Reboot server and you can now clear the logs in the monitoring path and they will not regenerate
Reason not required:If you take you time to look at the bottom of this config file it will say “Used for Exchange Online only” Microsoft have confirmed this has been set to true in error.
Note: Managed availability will never record any logs for the health probes and its value is stored in temporary memory only so we don’t need to worry about the health probes.
Hope this gives some idea in configuring the monitoring for Exchange 2016.
Thanks
Sathish Veerapandian
MVP- Office Servers and services


Leave a comment